Risk - What is it and How is it Measured?
Howard Marks Interview:
Chart 1 - Mean Return and Volatility for Overstock (OSTK) and Ruffer Investment Co (RICA), Source: The Spark and Bloomberg Data
Chart 2 - The Spark Portfolio’s Standard Deviation breakdown
Chart 3 - Weighted Beta across the Spark’s portfolio - see overall portfolio beta in the top right box
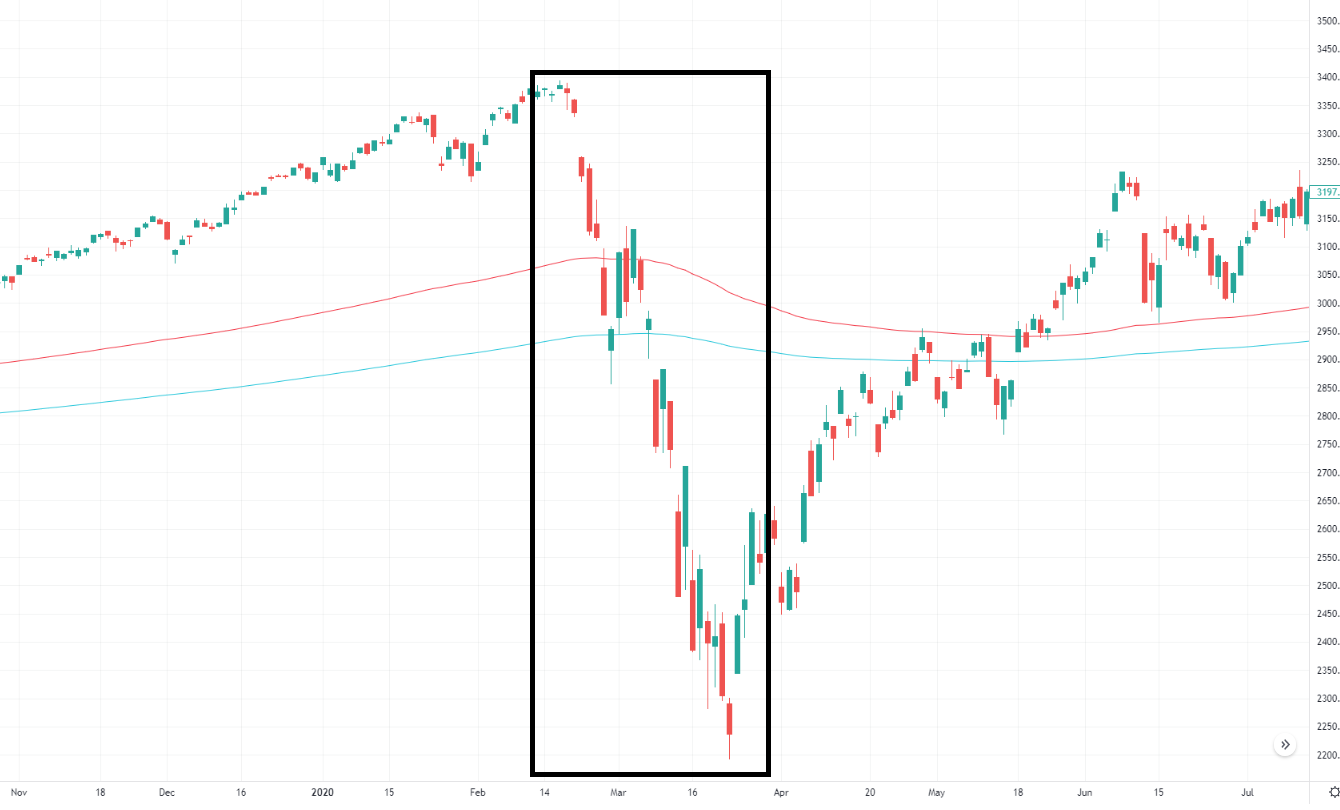
Chart 4 - COVID-19 Sell-off, low liquidity amplifies moves, Source: TradingView
https://www.thesparkportfolio.co.uk/newsletter/10questions - In-depth discussion on questions to ask when analyzing companies
https://www.thesparkportfolio.co.uk/newsletter/currencies - In-depth analysis of currencies
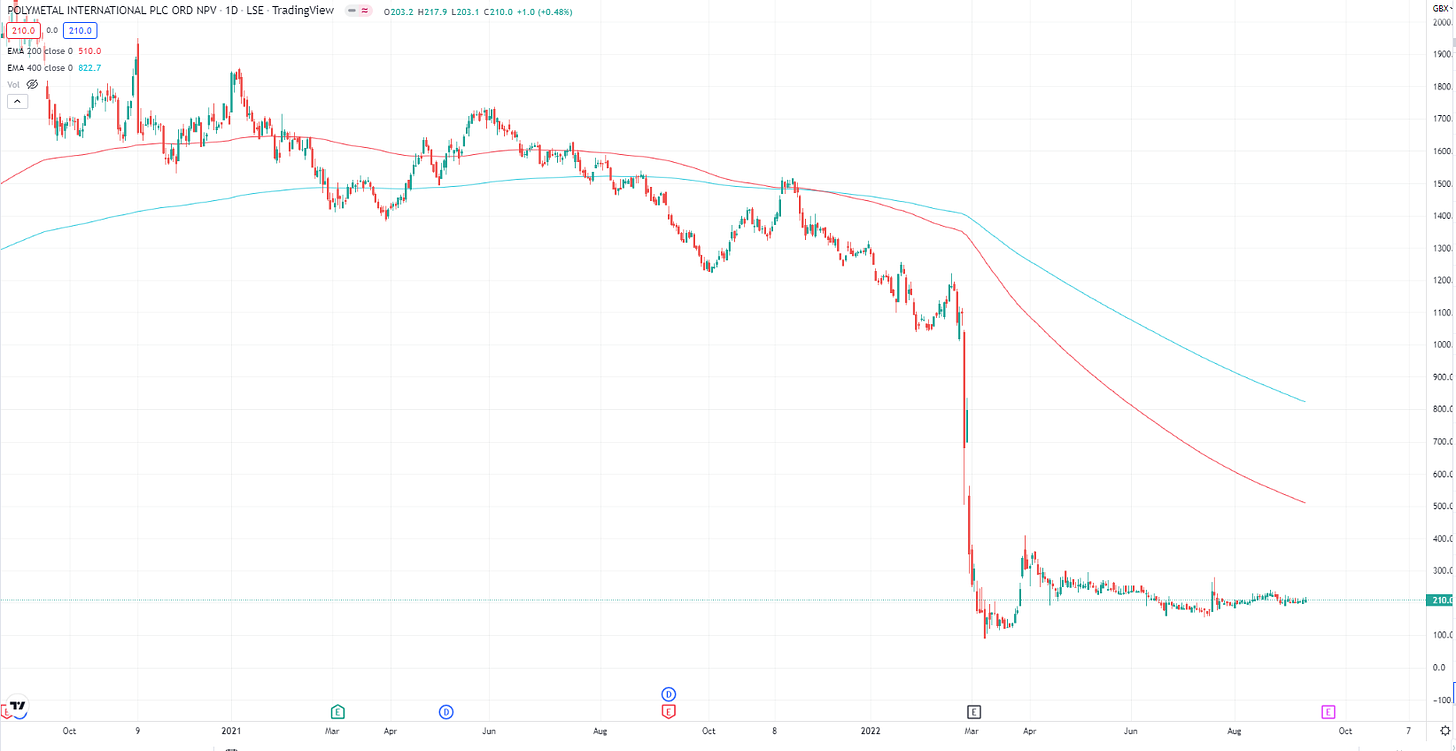
Chart 5 - Ouch! Geopolitical risk can cost you - Polymetal International (POLY) Share price, Source: TradingView
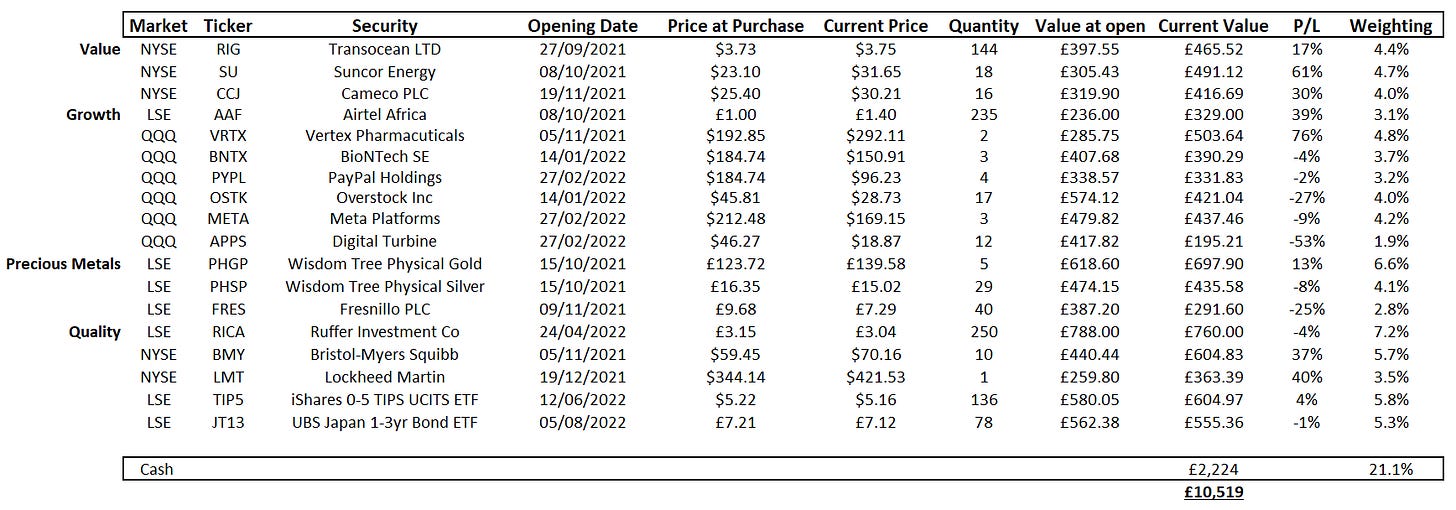
Portfolio Return Year-to-date: -0.7% vs S&P500: -15%
Total Return since inception (20/09/2021): 5.2% vs S&P500: -6.6%
Let me know your thoughts by emailing me at thesparknewsletter@gmail.com
See you next time,
Peter
Disclaimer
This communication is for informational and educational purposes only and should not be taken nor used as investment advice, as a personal recommendation, or solicitation to buy or sell any financial instrument. This material has been prepared without considering any particular recipient’s investment objectives or financial situation and has not been prepared in accordance with the legal and regulatory requirements to promote independent research. Any references to past or future performance of a financial instrument, index or structured product are not, and should not be taken as, a reliable indicator of future performance. I assume no liability as to the accuracy or completeness of the content of this publication.


